Grafana
Document writer <olivier.nicolas@insa-lyon.fr>
v1.0, 2023-03-01
Setting up Grafana to use your prometheus data
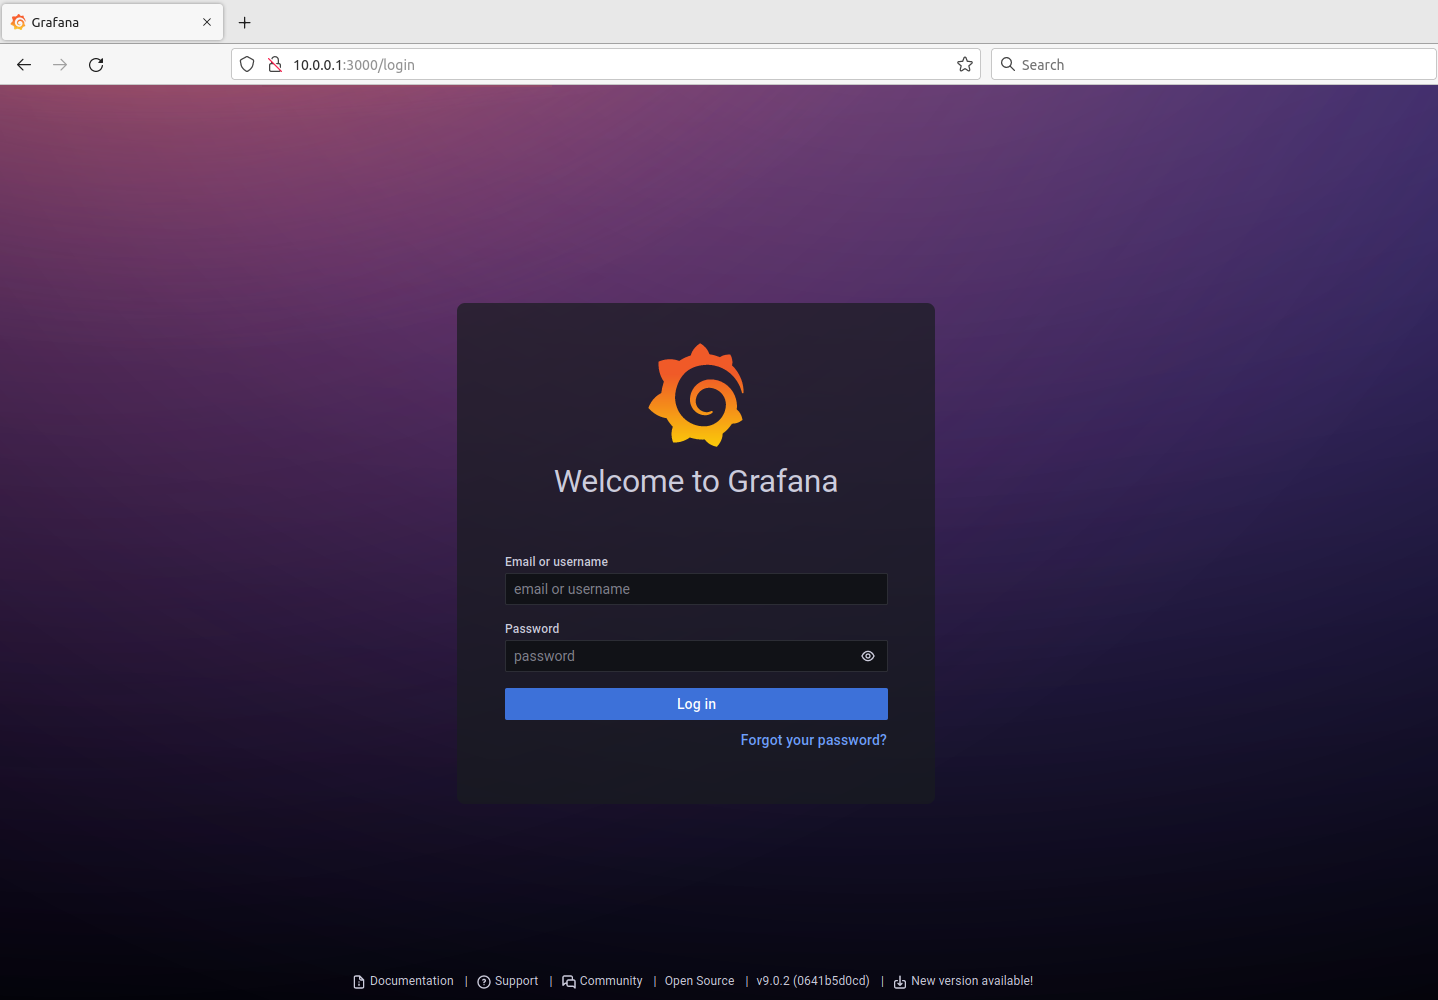
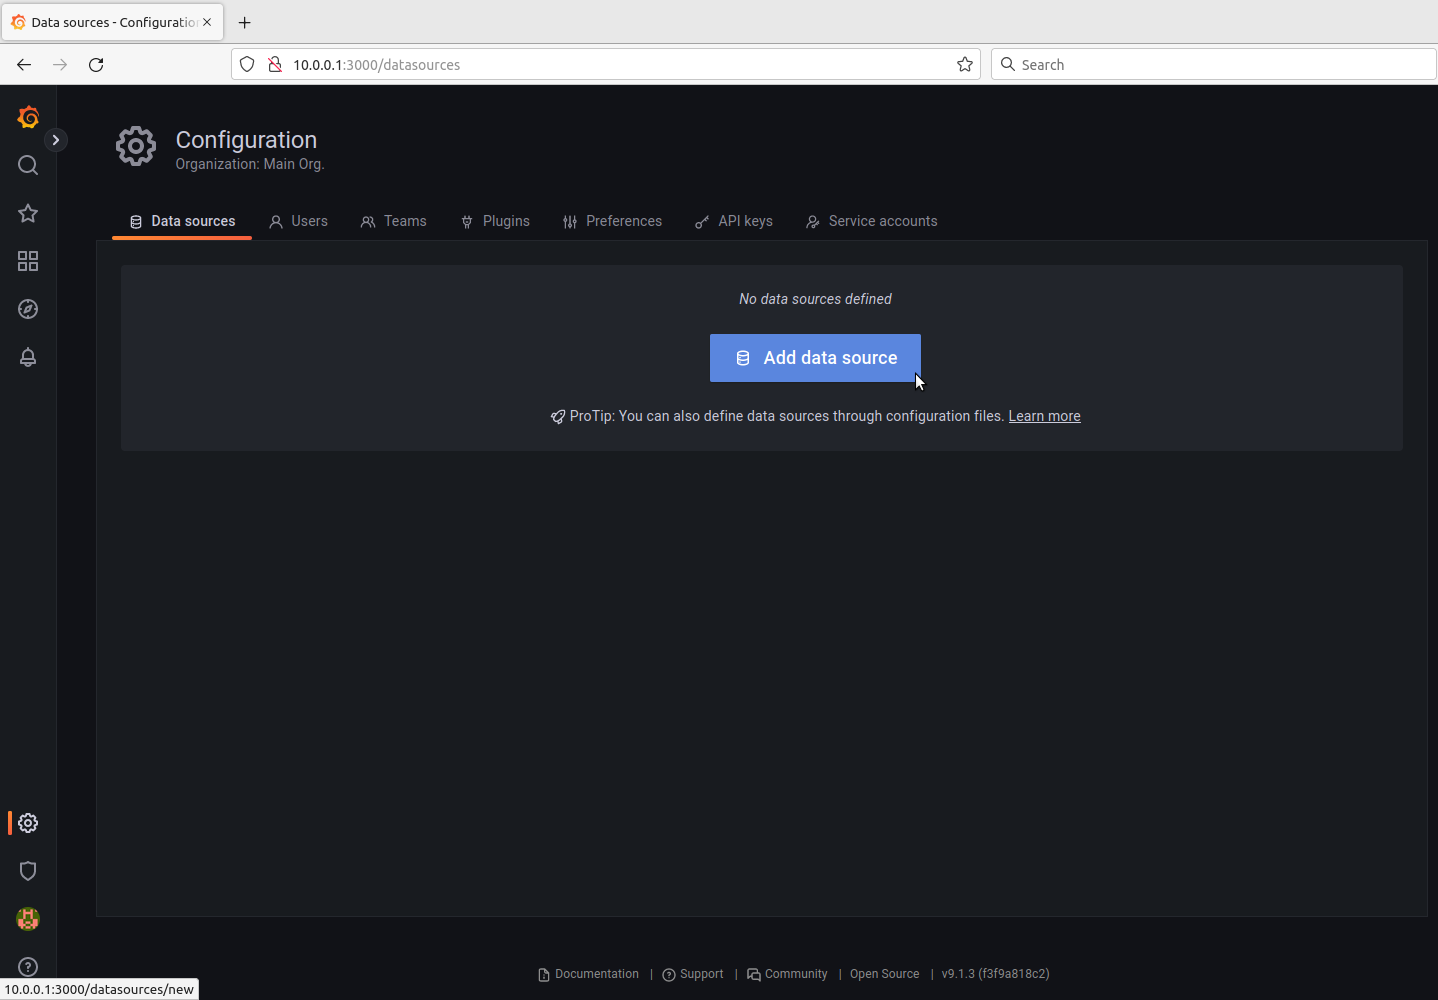
Step 1: get to the web address
On our example, that is: 10.0.0.1:3000/login
If need be, replace:
-
10.0.0.1 with the address of your server.
-
3000 (the default value) with the port you associated with grafana.

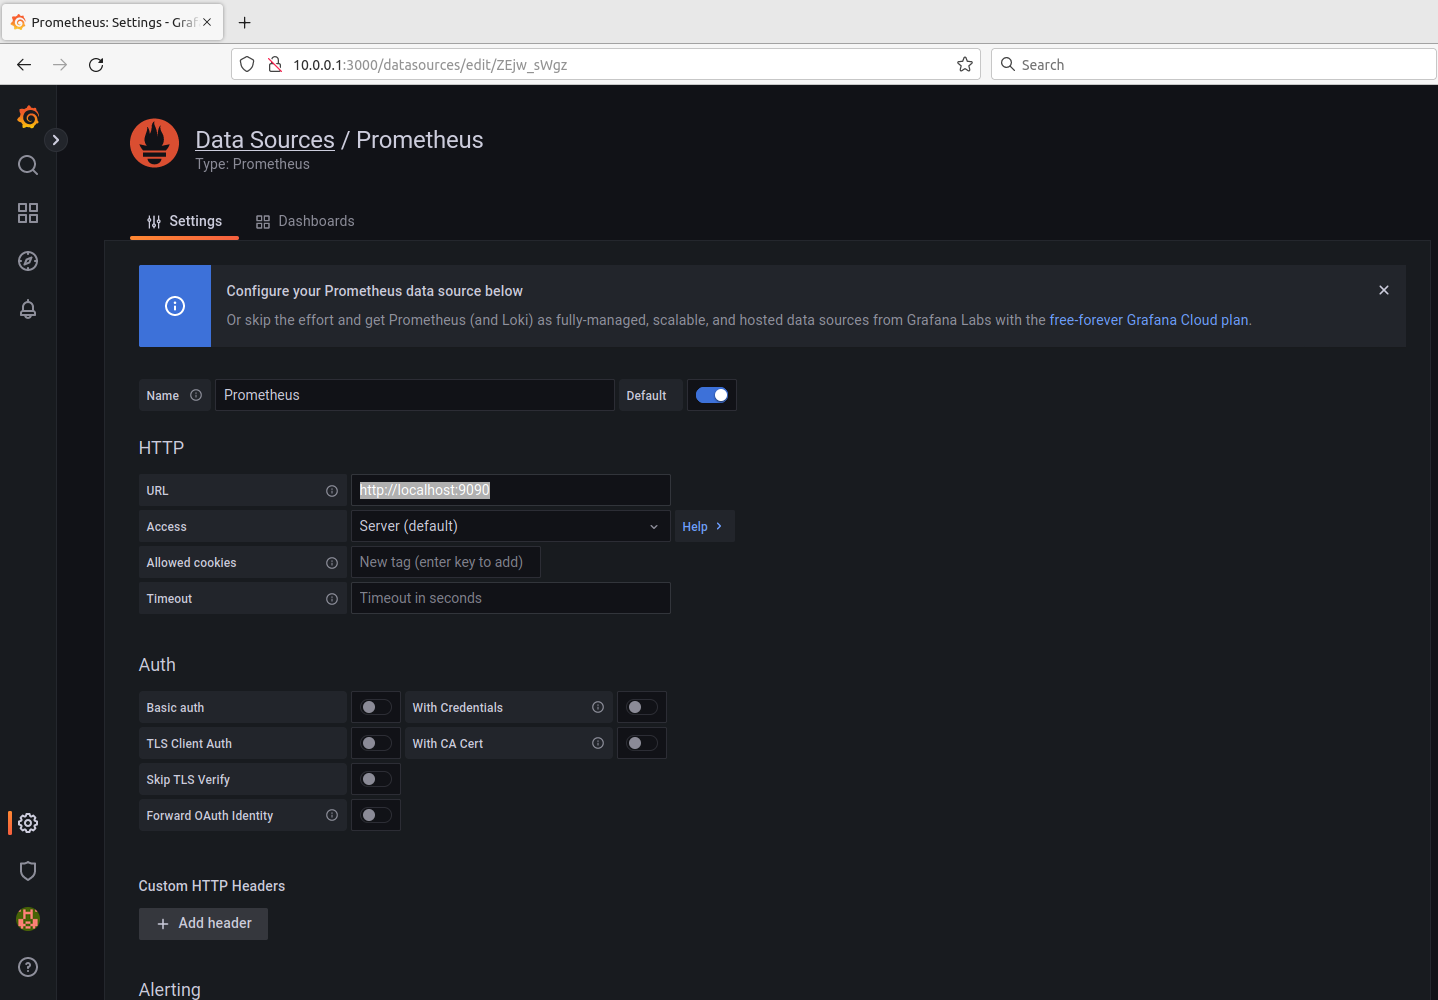
Step 6: the URL field
Enter in the URL field: http://localhost:9090
| it is already "filled in" but greyed out. Explicitly type the above content. |
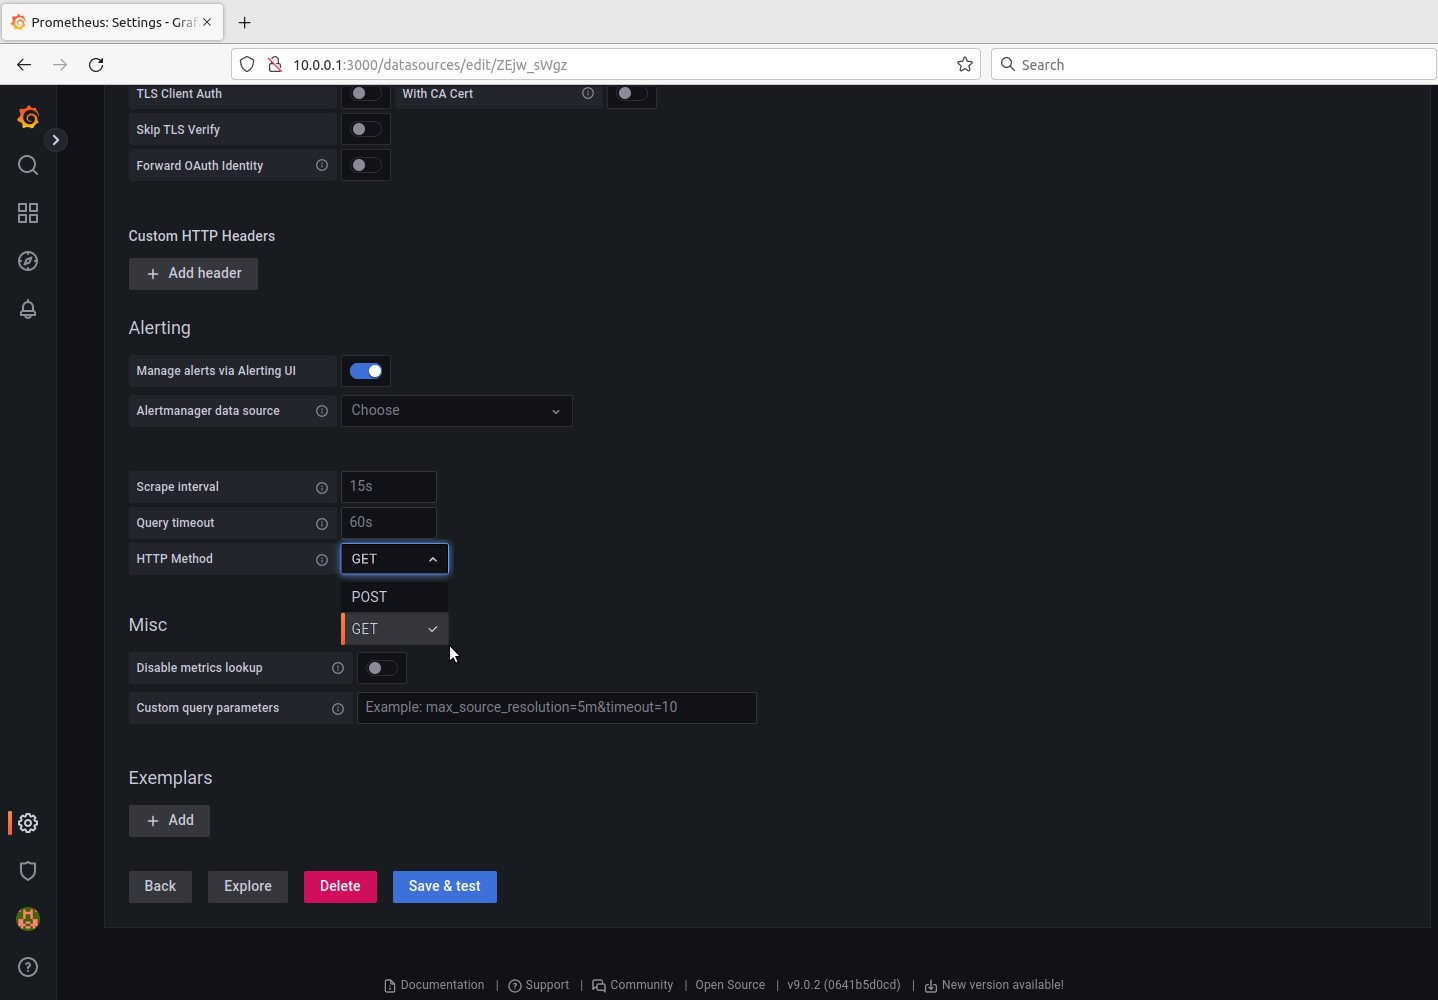
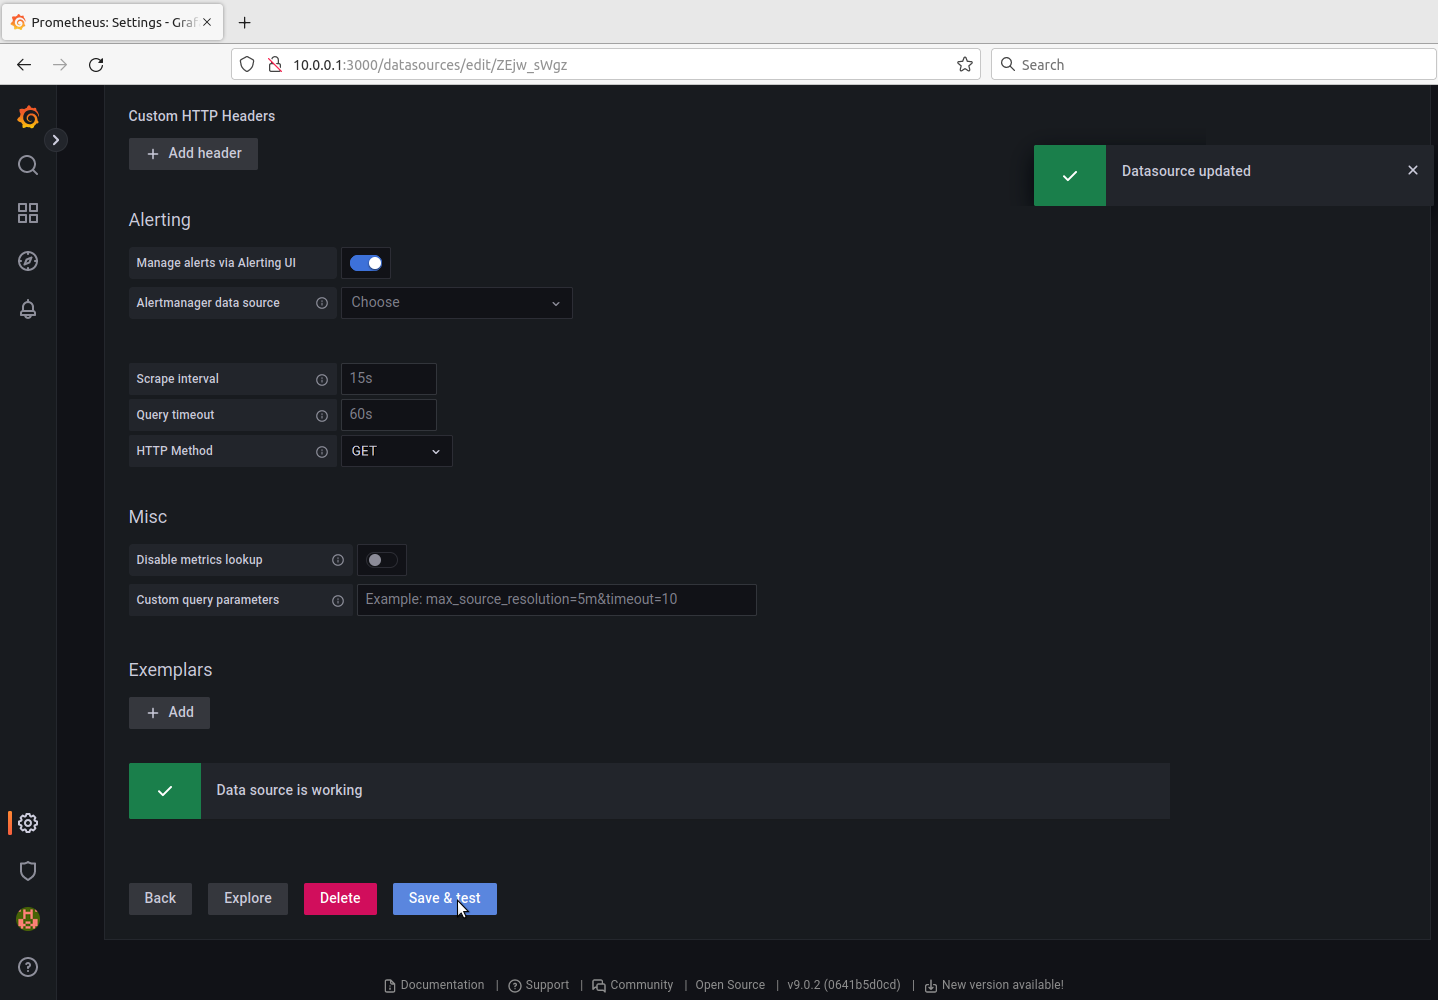
Step 8: Save and test
Click the blue field "Save & Test."
If all goes well youwill see the green check with the message "Datasource updated"
on the upper right corner.
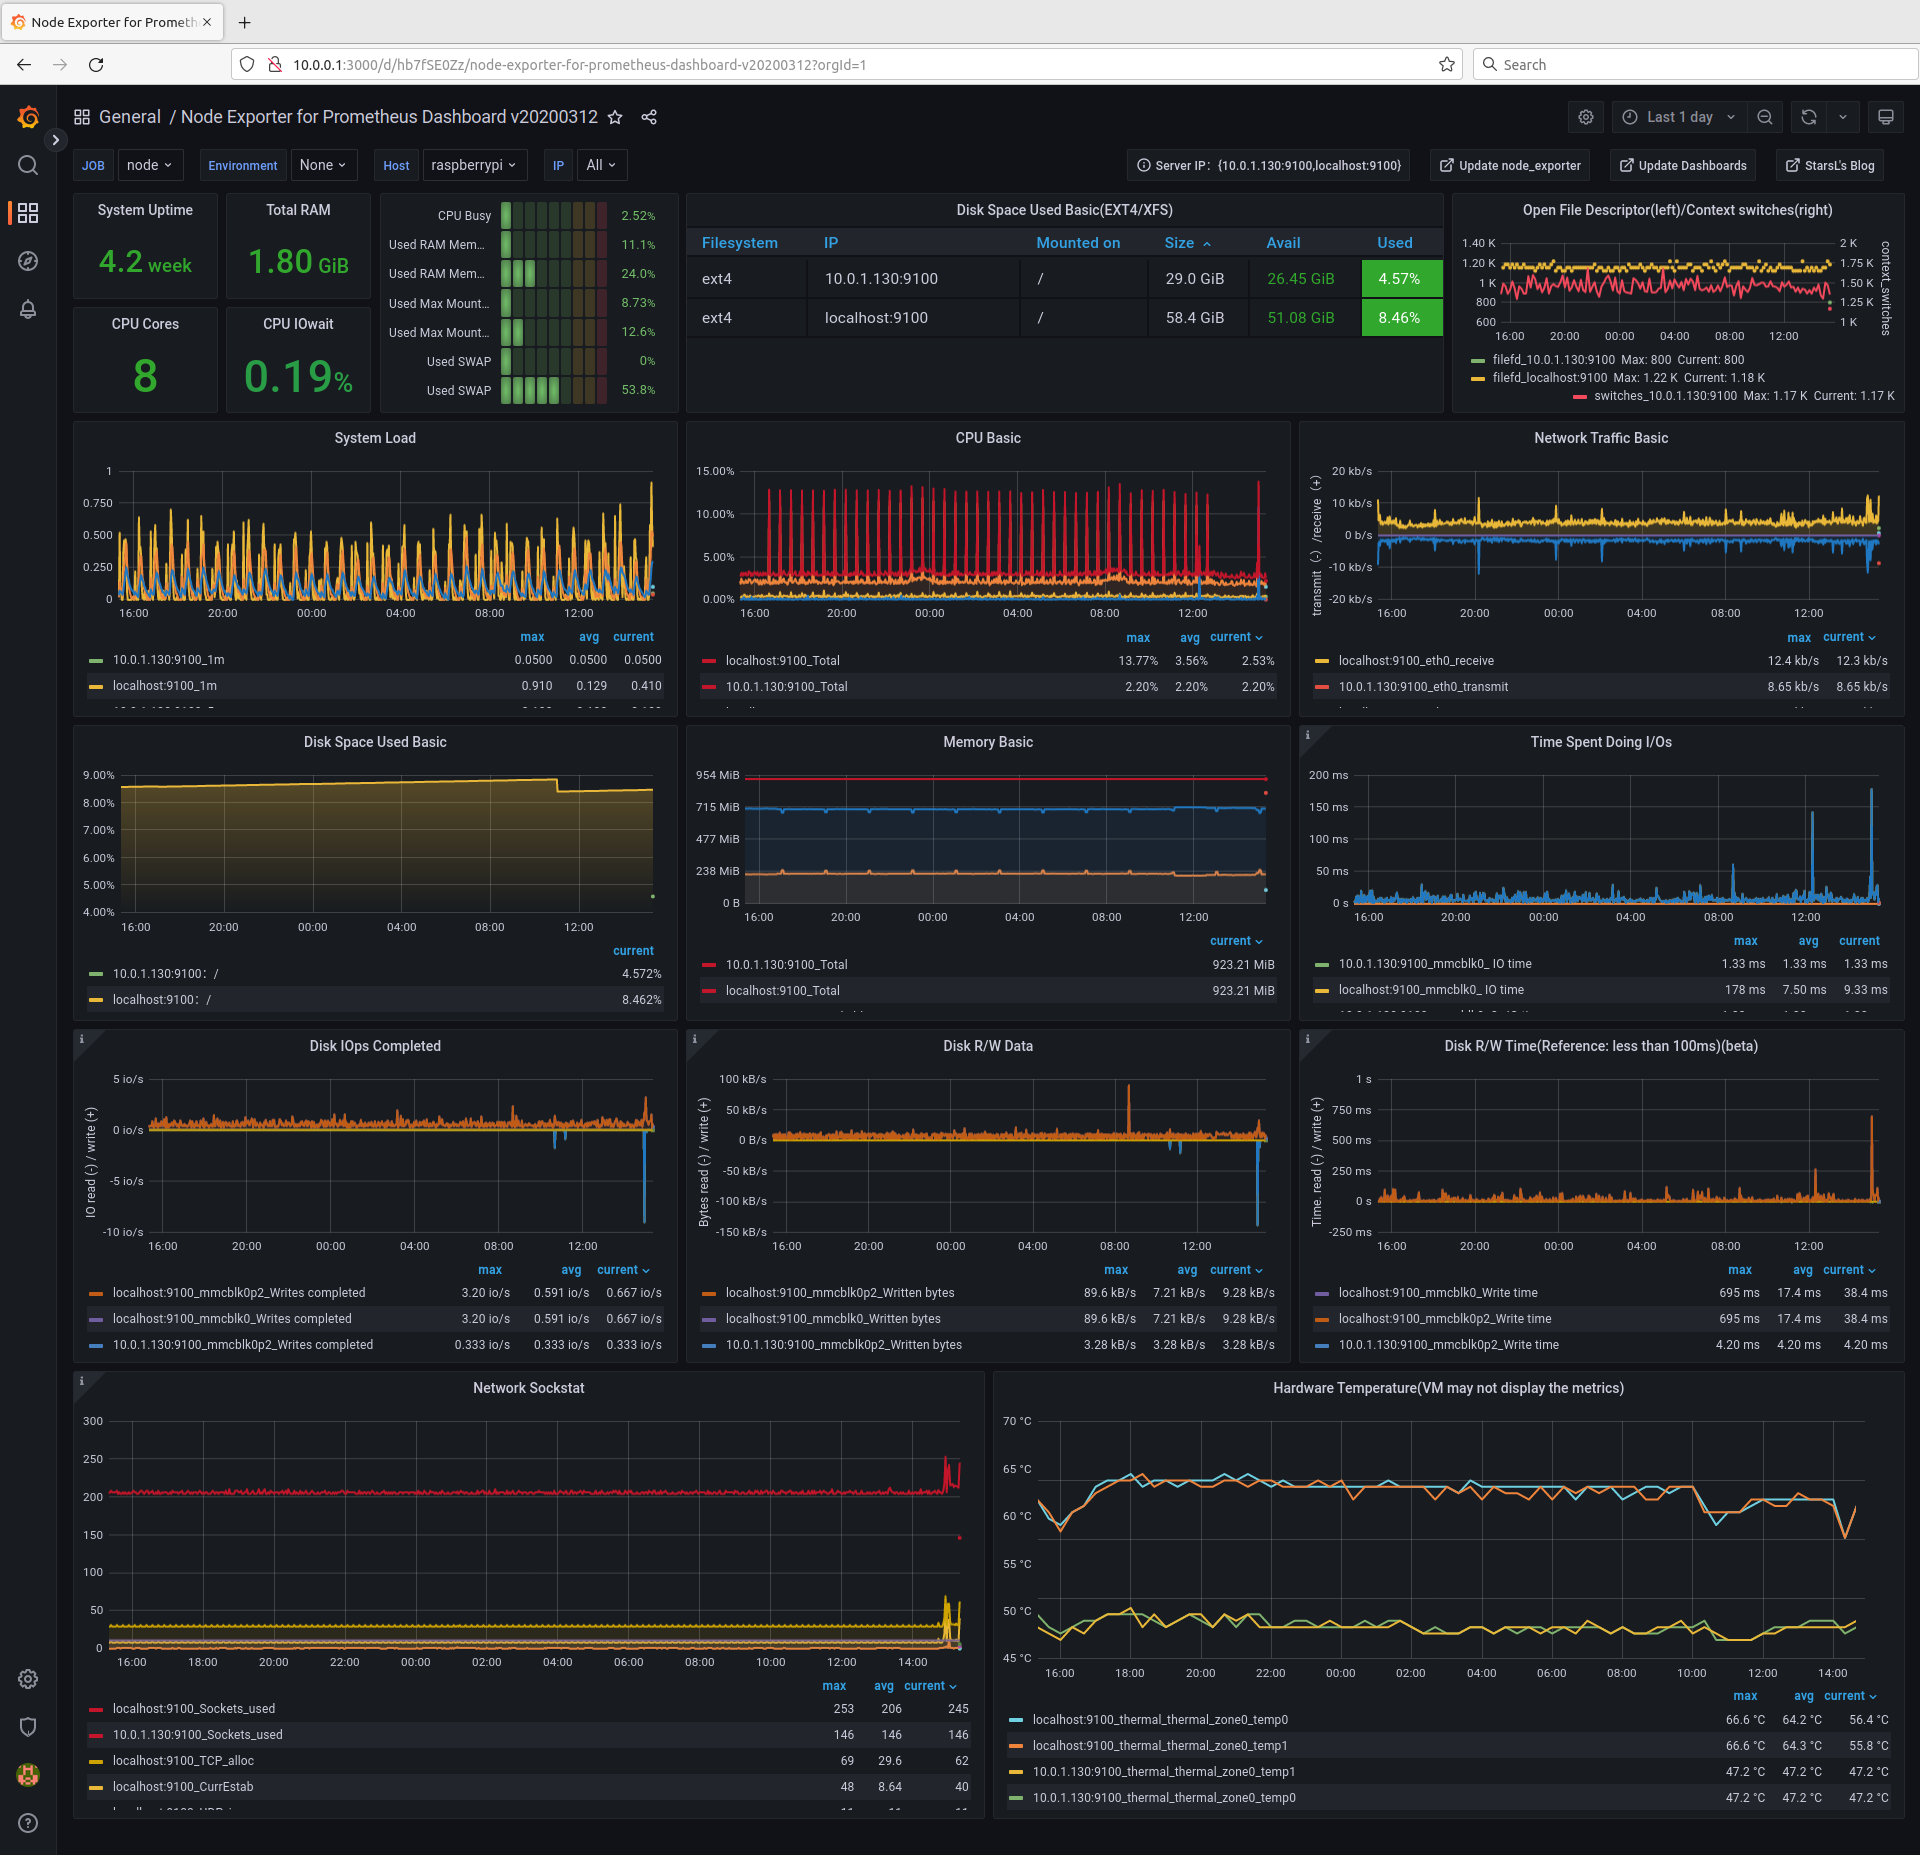
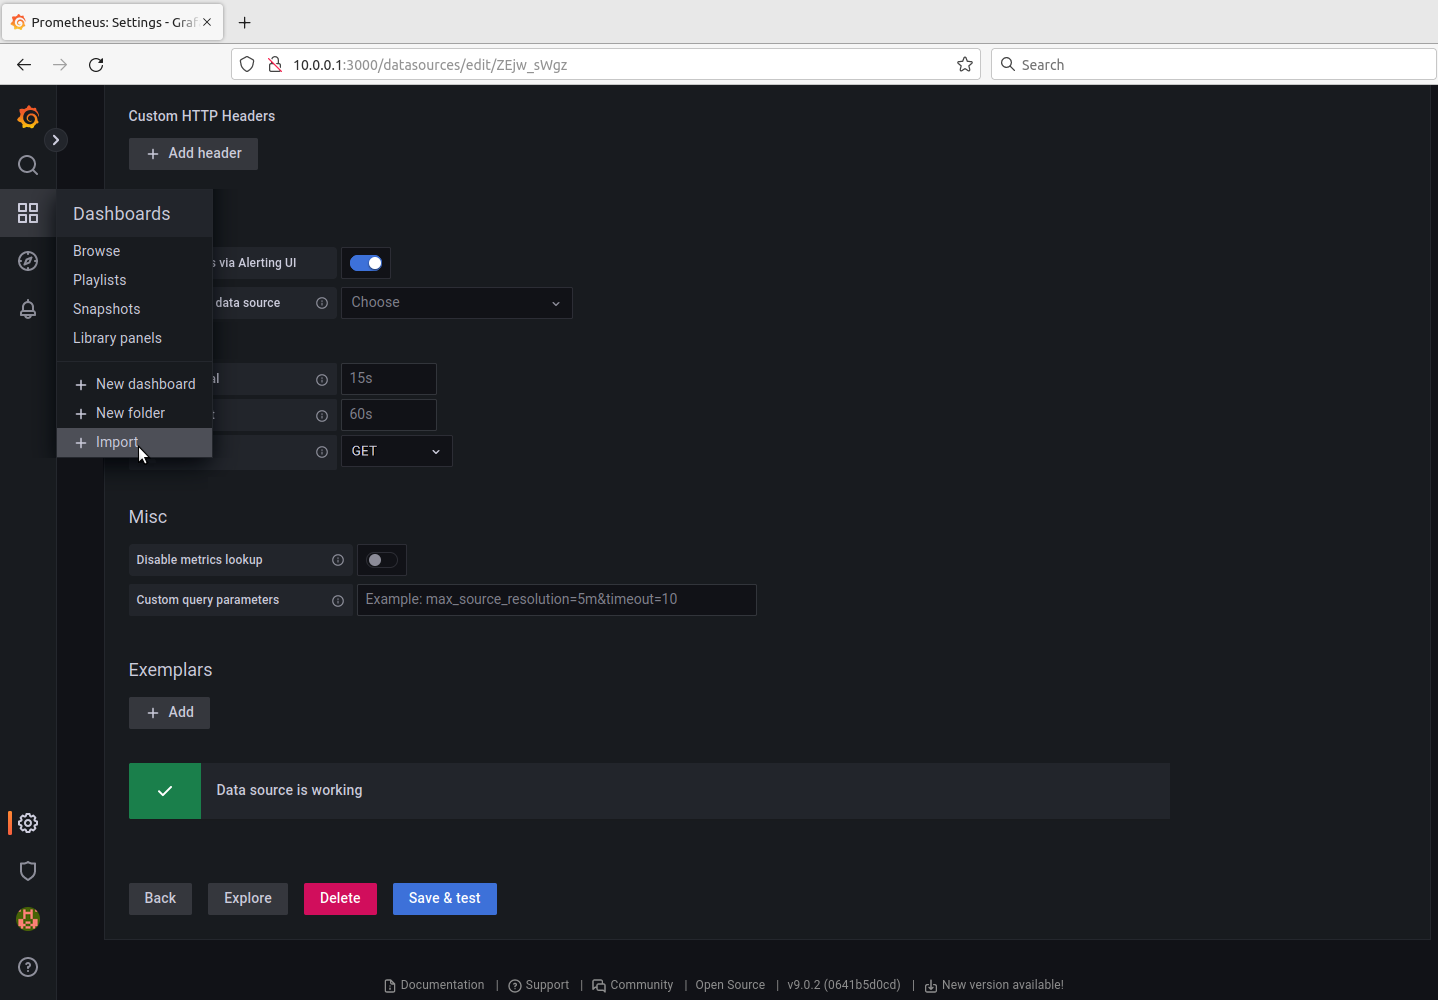
Step 9: Set a dashboard up
In our case we import an already existing one but you will probably want to customize
one for you needs.

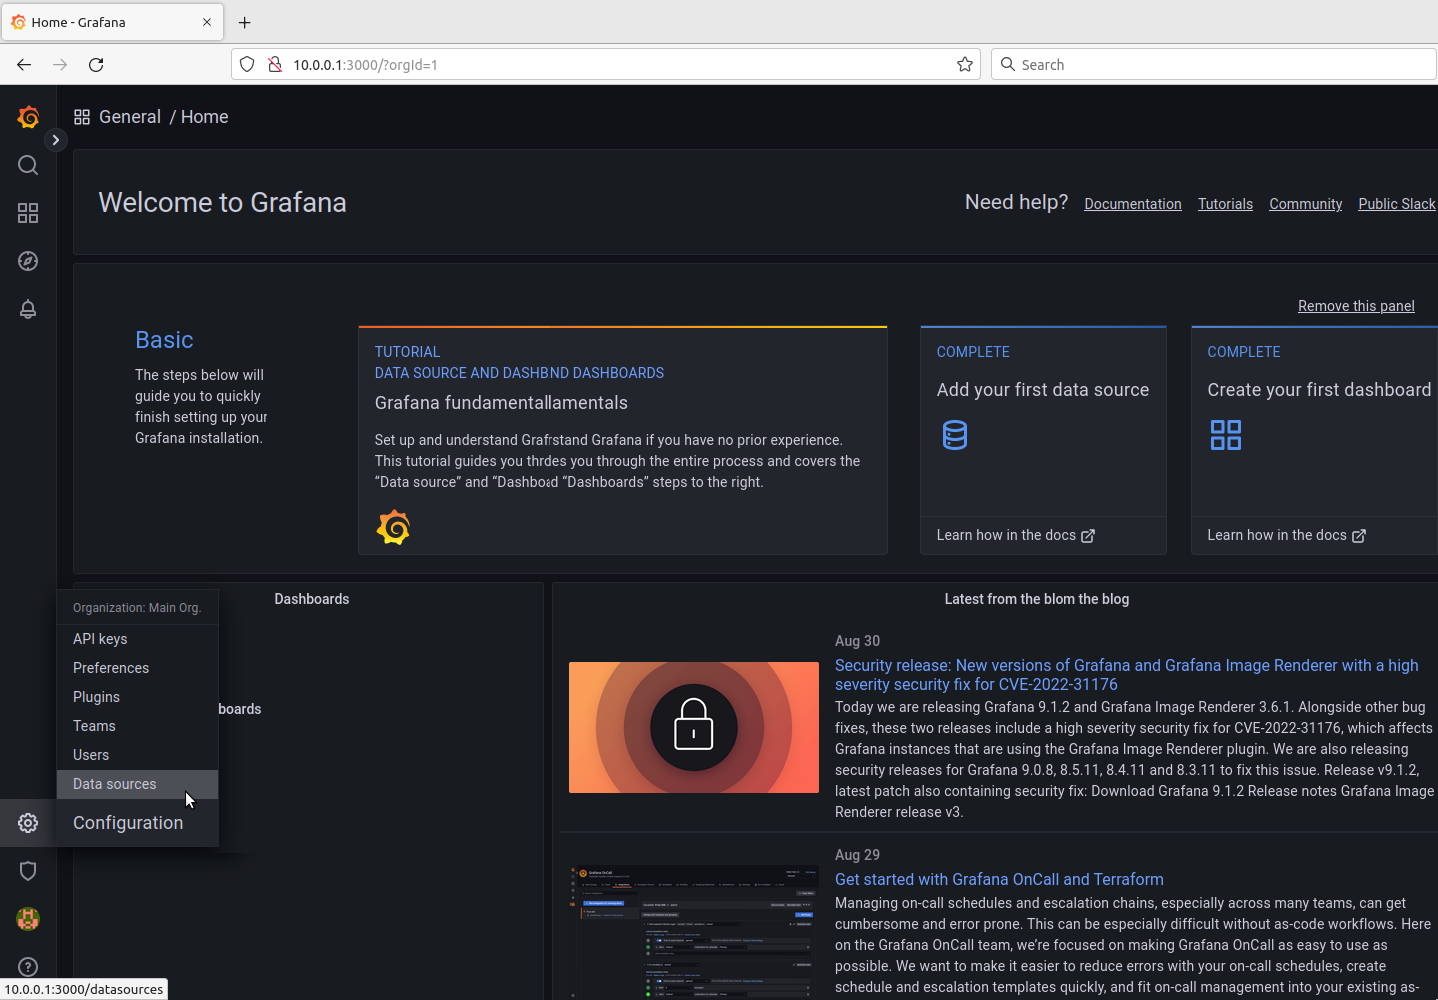
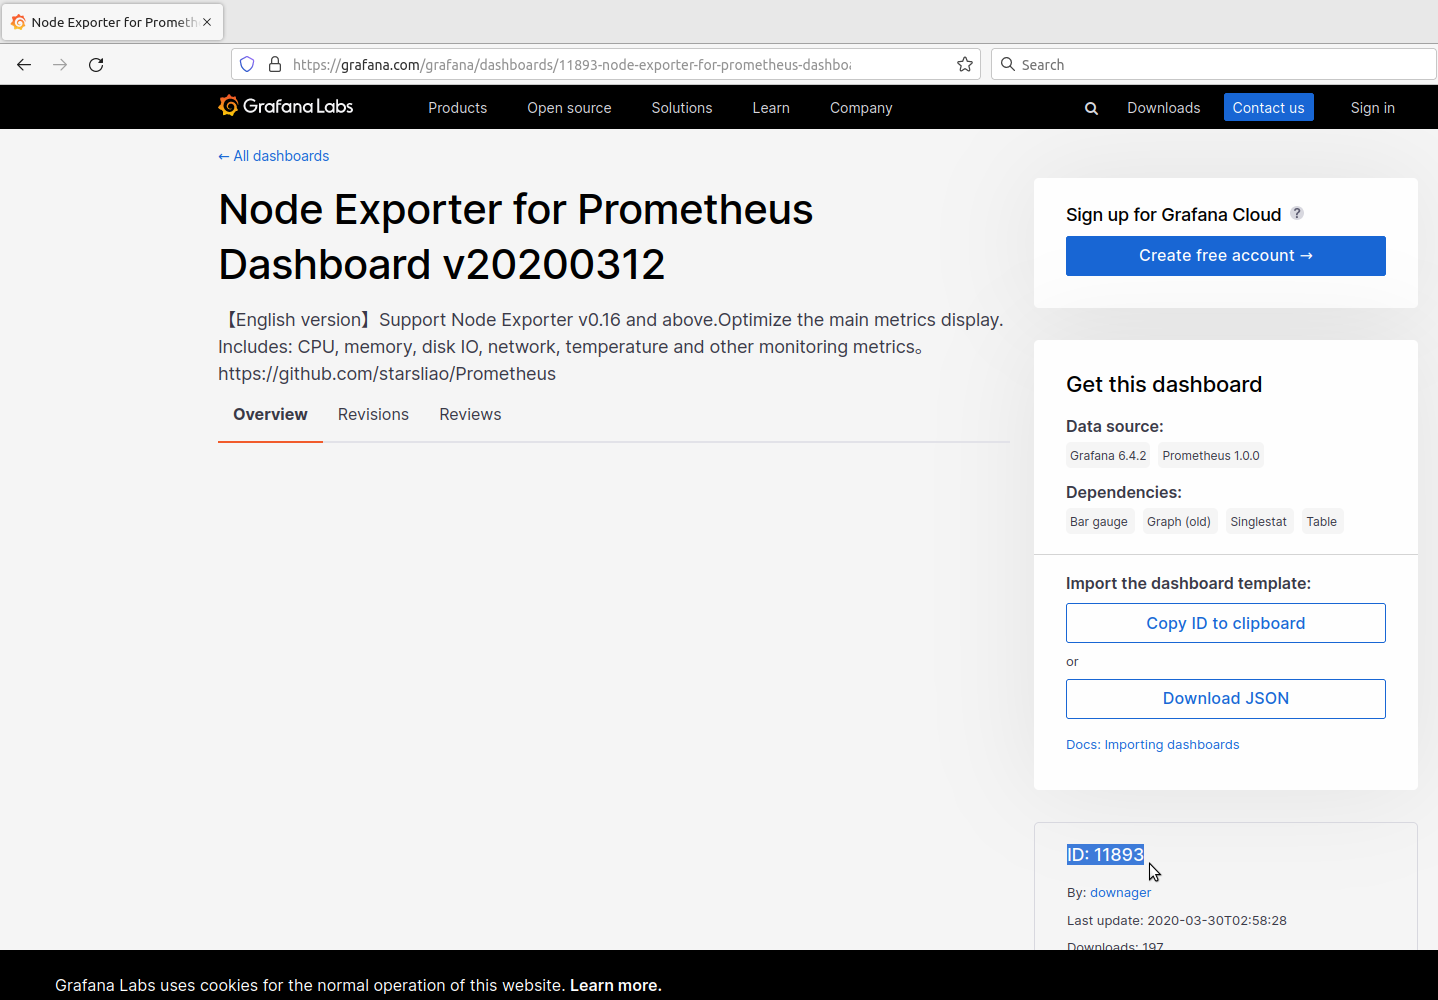
Step 11: Getting the dashboard ID.
We choose to go to grafana’s set to get the ID of an existing dashboard.
Navigate grafana’s website. window="_blank"
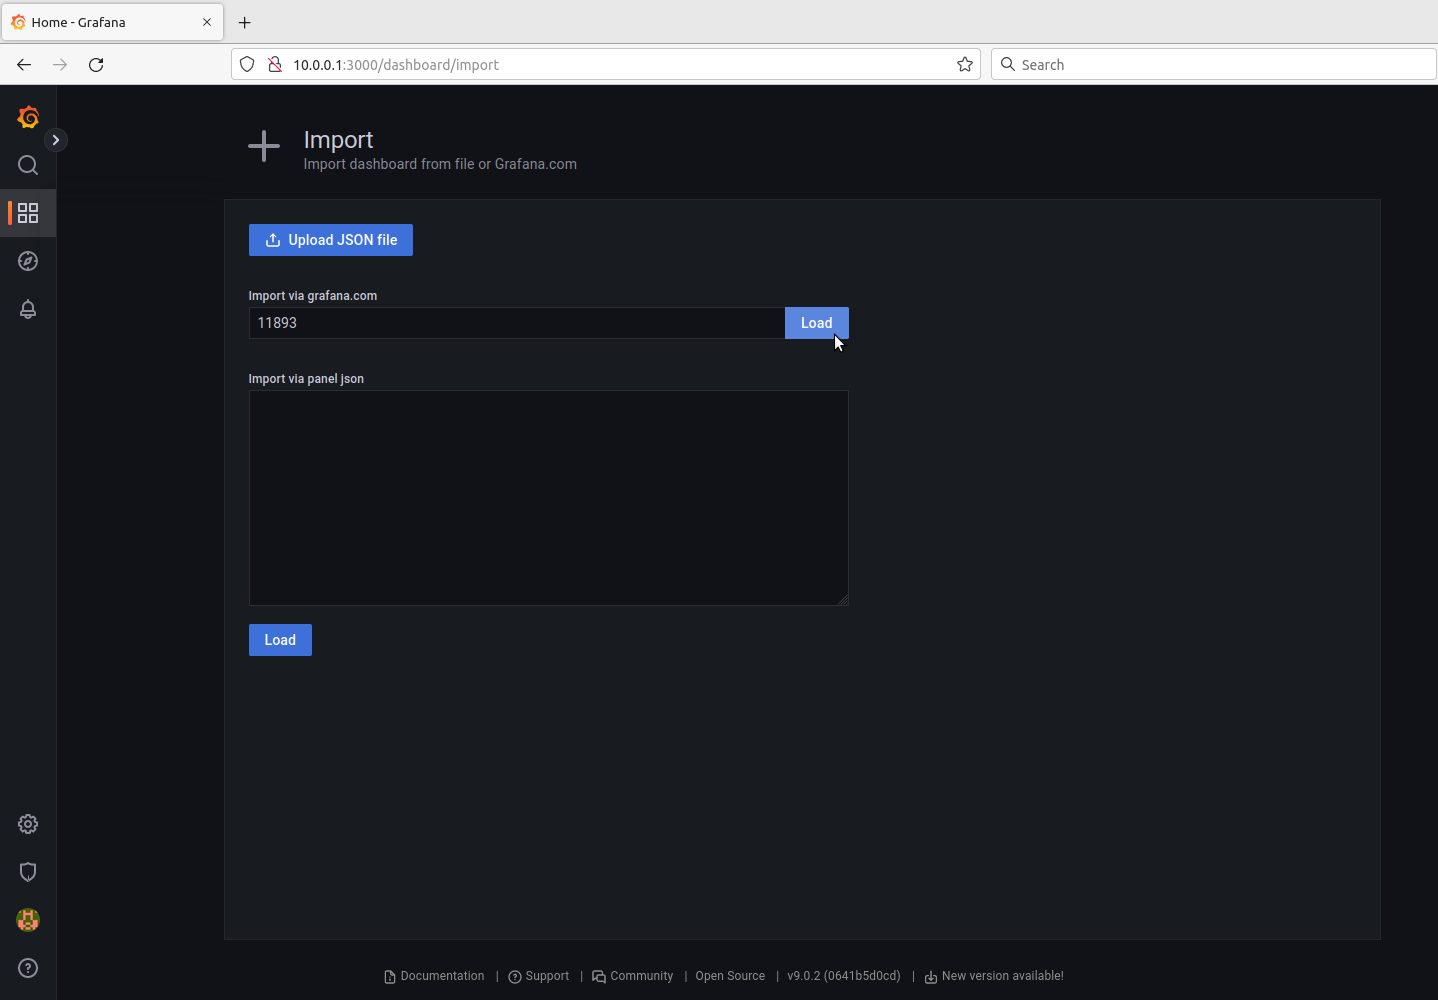
Step 12: Enter the selected ID
Enter the ID you got from grafana.com in the import field. And click Load.